9/12/2014-
This article was originally posted on the GWSNAP Tumbler in response to an article by the schools conservative newspaper on the SNAP challenge. That article has since been retraced. Re-posting this to my blog for just ghits and siggles.
Response to “SNAP out of it” article by Kevin Reagan
Hello, this is Tae Min Kim of GWU’s SNAP challenge initiative. First off, I would like to thank the GWU Patriot and Mr. Reagan for helping to spread awareness about the SNAP program. As they say all press is good press and true meaningful discussion about the SNAP program was and continues to be one of the principle goals of our initiative.
While I wish Mr. Reagan and the GWU Patriot would have reached out to me or one of the group members directly (Primary sources being the hallmark of good journalism) I would like the time to clarify some possible misconceptions in the GWU Hatchet article. As you no doubt understand, there are often nuances lost in a general article due to limited space etc…
The SNAP challenge is unrealistic
The SNAP Challenge figure of 31.50 is based off the national average of SNAP benefits according to FY 2010 data. It is, of course, an average. Furthermore our number of 31.50 closely mirrors the surrounding DC community. According to most recent USDA data, the average monthly benefit per person in the District of Columbia in FY 2012 was 137.74. There being an average of 30.4 days per month (365/12) it means a daily benefit of 4.53 cents (rounded to the nearest hundredth). Multiply that by 7 and you get 31.71 or very close to 31.50.
I assume you took the monthly benefit of 159 per month and divided by 4 weeks leading to your figure of 39.75. If every month had 28days (I.E. February on a non-leap year) this would be correct. Using the CBPP’s 2013 data the numbers actually turn out to be 36.61 for 7 days. Now I remind you that the SNAP challenge does use the FY 2010 data and there could be a case to be made to update the challenge to reflect that. 1
SNAP stands for Supplemental
Erroneous mathematics aside, let us move on to the Supplemental aspect of the program. You are correct; the S in SNAP does stand for supplemental. For most households the SNAP benefit is not meant to cover all a family’s food needs in a given month precisely because the family is expected to buy some food from its own resources. However, the reality reflected in USDA SNAP Food Security In-Depth Interview Study in March of 2013 found that many households plan their food budget with SNAP as a foundation.
“Families often build their monthly budgets around SNAP, allocating their fungible cash resources toward their bills and other, often urgent, financial needs triggered by a sudden loss of income or increase in expenditure.”2(In-depth study,USDA, xi)
Now I do agree that this is a problem and SNAP shouldn’t be considered a foundation for the food budget. Furthermore most families run out of SNAP benefits by the 3rd week and consequently forgo paying bills to purchase food.
“It is very difficult, very difficult. I am working…part time. I’m a single mom of two, and it seems like nothing is ever enough. No matter how many hours I put in it’s not enough for what I need at home. I thank God that at least [I have] the SNAP benefits. It’s the only way I can make it. Other than that, I wouldn’t have anything to eat.” (In-depth study, USDA, 14)
The above quotation is an accurate reflection of the households on snap. They are living very close to the economic margin. You also noted correctly that to qualify for SNAP a family must be at or under 130% of the poverty line. For a family of 3 that means they make under 24,817 dollars annually using 2012 FPL guidelines. 24,817 for 3 people to include housing, utilities and all other expenses is very little.
Legitimate abuses of the program
Moving on let us address the legitimate abuses of the program. Yes abuse happens but let us again turn to hard data and facts to see what truly is going on.
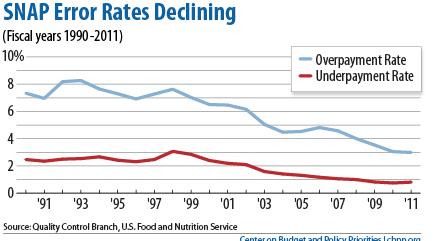
SNAP has one of the most rigorous quality control systems of any public benefit program. Furthermore, there has been aggressive action taken by the federal government to combat SNAP abuse and fraud. For example, the share of SNAP payments that represent over-payments or payments to ineligible households was reduced to 2.99%. Currently over 99% of those receiving SNAP benefits are eligible and payment accuracy was at 96.2%, a historic high.
Culture of dependence.
Again let us discuss facts. The “8 and a half year” dependence statistic comes from Robert Rector’s testimony at the Heritage foundation on June 27, 2001. Let’s continue the discussion with more up to date, relevant data as we are over a decade past the legitimacy of the figure.
A House Budget Committee analysis titled “The Path to Prosperity” released in March 12, 2013 shows the majority of SNAP recipients who can work do so. For families with children, more than 60% of households work while receiving SNAP and almost 90% work in the prior or subsequent year.3
Hopefully this has cleared up any possible confusion on not only the GWU Initiative, but the SNAP program as a whole. Please do not hesitate to contact me in the future.
Tae Min Kim
References and Background:
- SNAP Benefits Average by State: http://www.fns.usda.gov/pd/18SNAPavg$PP.htm
- Nutrition Assistance Program Report Series: Office of Research and Analysis “SNAP Food Security In-Depth Interview Study: Final Report” USDAhttp://www.fns.usda.gov/ORA/menu/Published/SNAP/FILES/Participation/SNAPFoodSec.pdf
- The Path to Prosperity: A Responsible, Balanced Budget,House Budget Committee, March 12, 2013, p. 29.
General Background:
For more information on SNAP:http://www.fns.usda.gov/ORA/menu/Published/SNAP/SNAP.htm#Building

Recent Comments